

Please check back with us for the latest news, announcements, and updates at Park Allergy Center!
Take a look at these mortality rate figures from the United States government that can be found on the CDC website. https://www.cdc.gov/nchs/data/vsus/vsrates1940_60.pdf
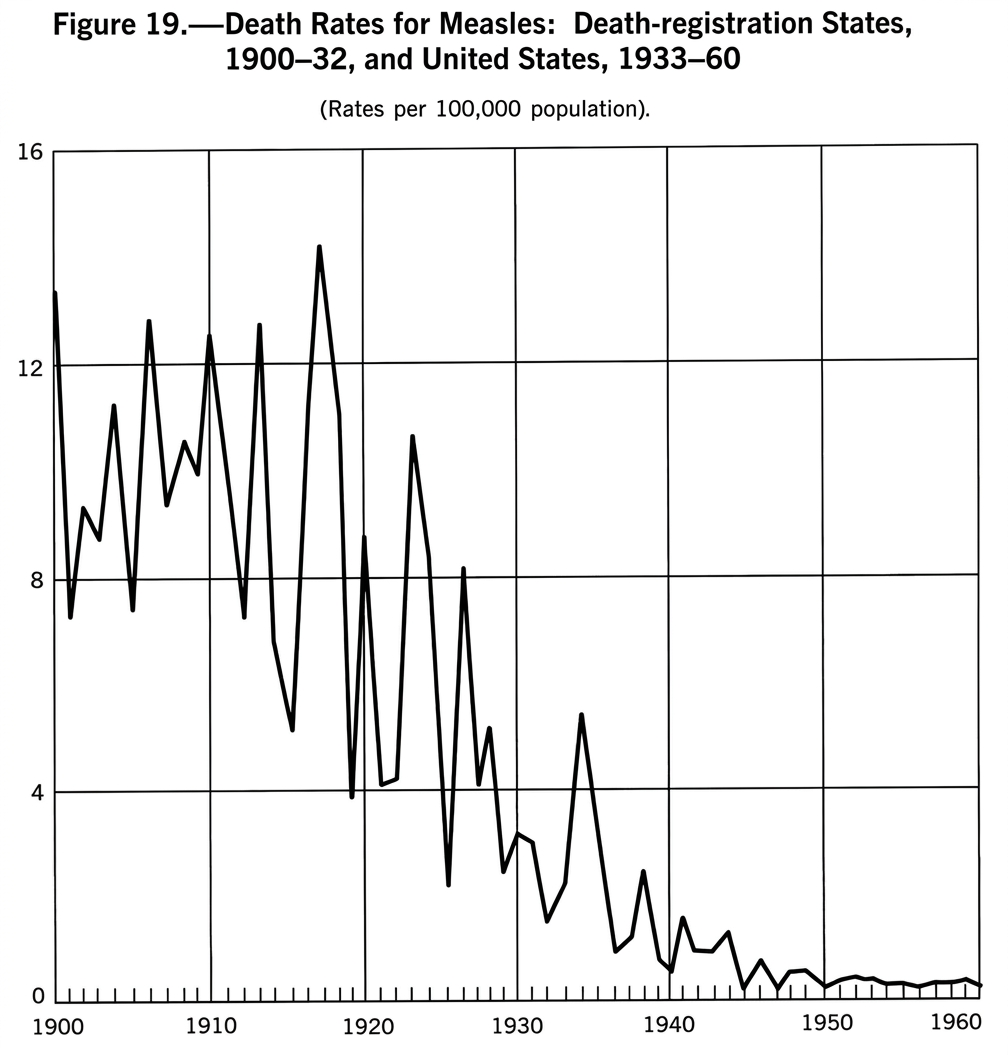
From 1900 to 1960, the mortality rate of measles declined by over 98%. Here’s the problem for the Pro-Vaccine Crowd, the measles vaccine was not released until 1963, and not largely adopted until 1967. How could the measles vaccine have contributed to this decline in mortality? The answer is – it didn’t.
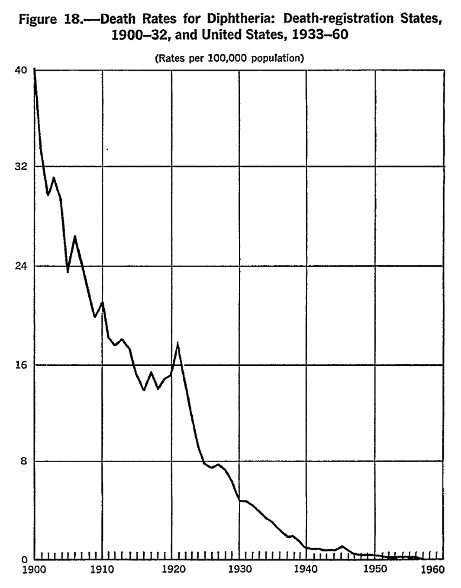
From 1900 to 1926, the mortality rate of diphtheria declined by 81%. The diphtheria vaccine was first released in 1926 and not largely adopted. By 1949, the mortality rate had declined by 98%. Similar mortality rate declines can be seen for both pertussis and tetanus. The DPT vaccine was released in 1949, AFTER the 98% decline in mortality rate. So, how many lives have been saved by the DPT vaccine? Certainly not millions…
Interestingly, the mortality rate for many different diseases also declined during the 1900s.
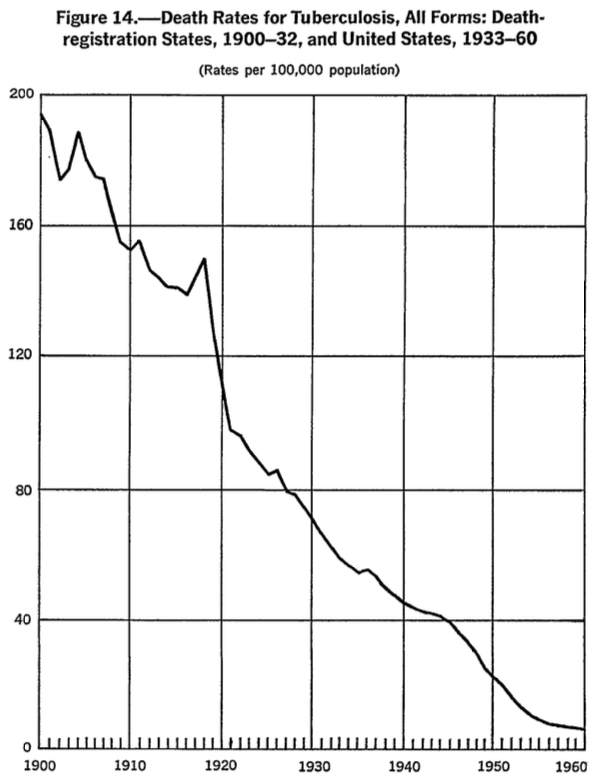
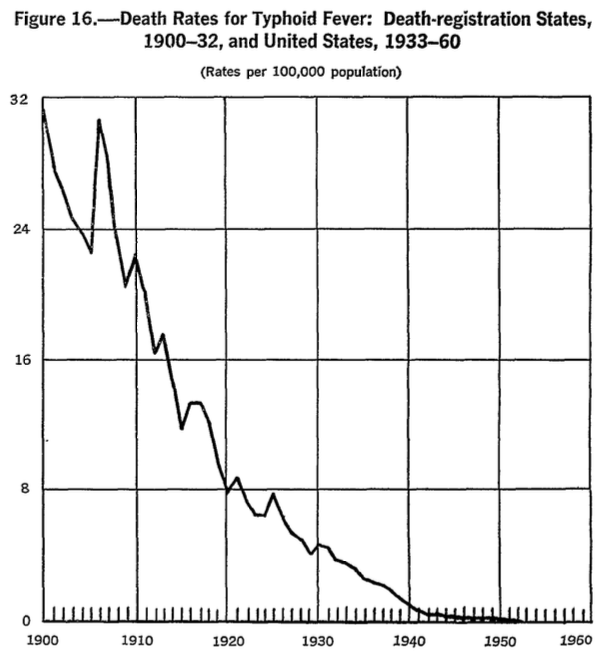
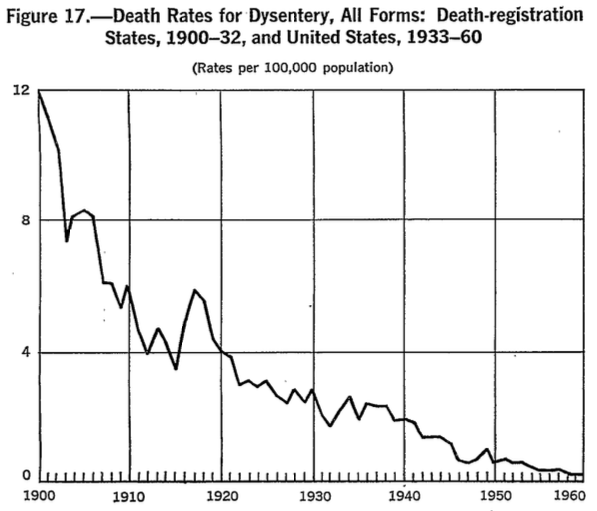
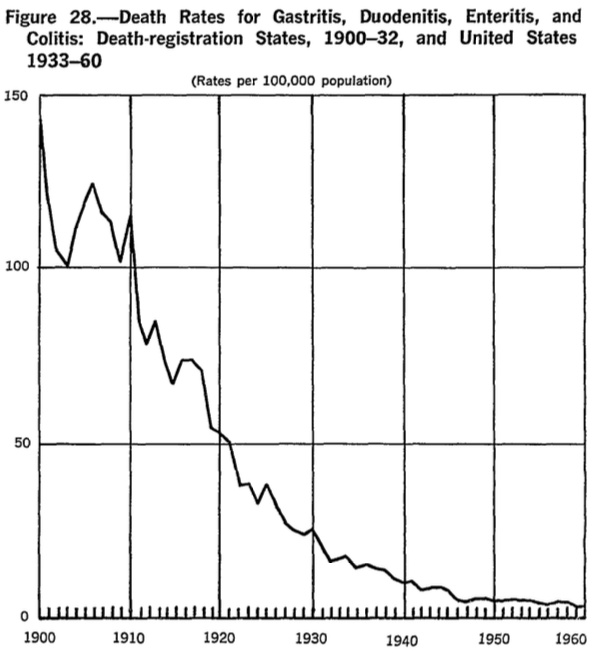
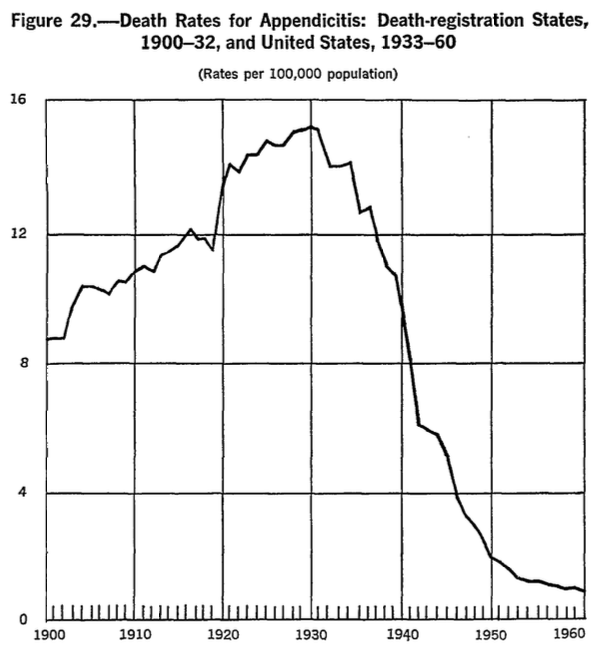
Are you getting the picture? There is no vaccine for the above conditions, and yet their mortality rates plummeted around the same time as measles and diphtheria. In every case, whether it’s measles, diphtheria, polio, or pertussis, the vaccines were released AFTER significant declines in mortality. The vaccines had nothing to do with it.
So if it wasn’t the vaccines, then what was responsible for this improvement in mortality? Certainly, advancements in surgical techniques and medicine in general helped. But, in my opinion, a few particular factors were involved.





and


The last two in particular (Ford Model T and indoor plumbing) significantly diminished the fecal-oral route, perhaps the most significant mode of transmission for many infections and diseases.
On September 9, 2025, the American public learned for the first time of the existence of the largest U.S. vaccinated vs. unvaccinated birth cohort study ever conducted. This study was done at Henry Ford Health Systems in Detroit Michigan but was never published. Under oath, attorney Aaron Siri testified that in personal conversations with the lead authors, they felt the design and merits of the study were strong, but feared publication would jeopardize their careers. In December 2025, a peer-reviewed analysis of the Lamerato et. al. study was published, A Peer-Review of the Vaccinated vs. Unvaccinated Study Discussed at the Senate Heating on September 9, 2025.
The original study was conducted from 2000 and 2016 and included 18,468 children born during that time. 16,511 received at least one vaccination. 1,957 had no vaccinations.
The reanalysis demonstrated that the vaccinated group was sicker in all 22 chronic disease categories listed in the study.
There was a 549% higher rate of autism-associated neurodevelopmental conditions in the vaccinated group.
There was a 54% higher rate of childhood cancer in the vaccinated group.
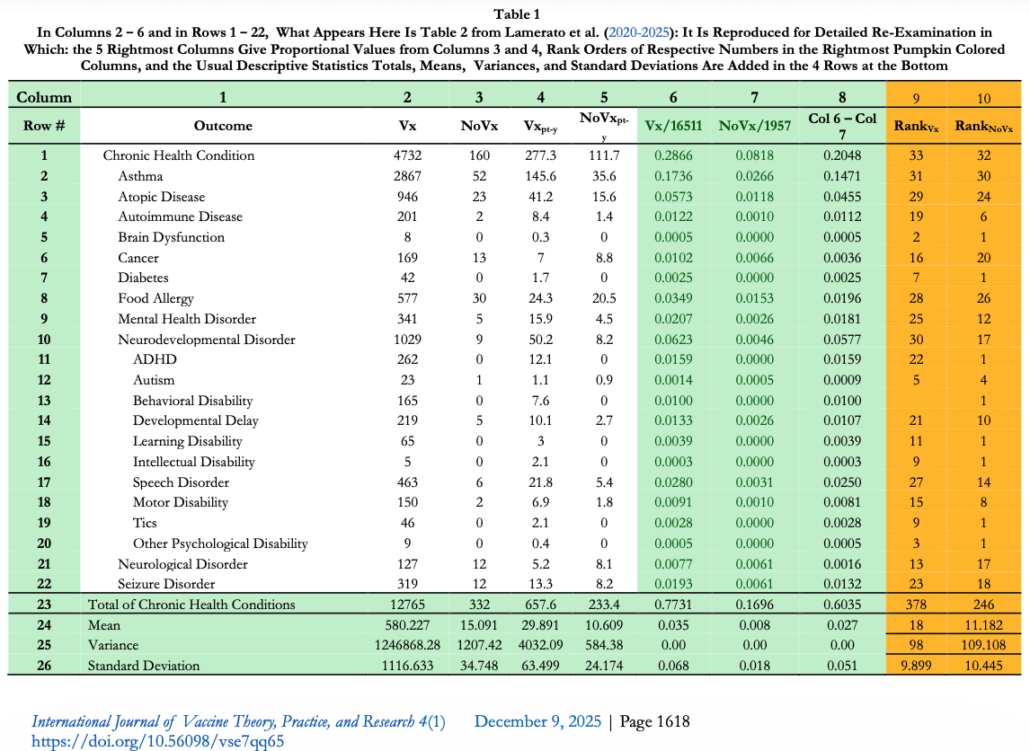
All of the following conditions were higher in the vaccinated group.
- Chronic health condition – 250% higher
- Asthma – 553% higher
- Atopic disease – 386% higher
- Autoimmune disease – 1120% higher
- Brain dysfunction – Present only in vaccinated group
- Cancer – 54% higher
- Diabetes – Present only in vaccinated group
- Food allergy – 128% higher
- Mental health disorder – 696% higher
- Neurodevelopmental disorder – 1254% higher
- ADHD – Present only in vaccinated group
- Autism – Present only in vaccinated group
- Behavior disability – Present only in vaccinated group
- Developmental delay – 412% higher
- Learning disability – Present only in vaccinated group
- Intellectual disability – Present only in vaccinated group
- Speech disorder – 803% higher
- Motor disability – 810% higher
- Tics – Present only vaccinated group
- Other psychological disability – Present only vaccinated group
- Neurological disorder – 26% higher
- Seizure disorder – 216% higher
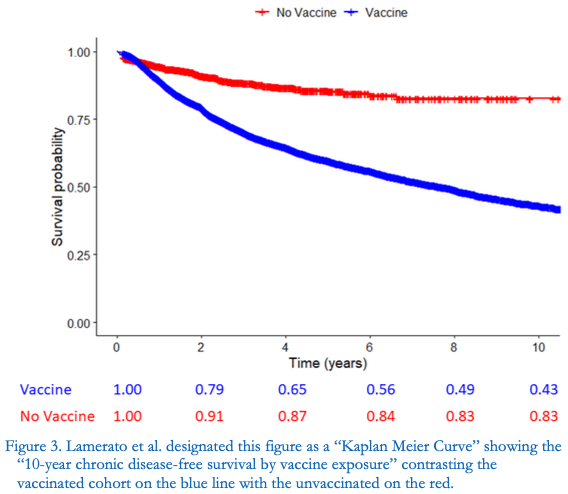
Only 43% of vaccinated children are healthy by age 10.
83% of vaccinated children remain healthy by age 10.
This study was published in Academic Pediatrics in early 2023 and was funded by the CDC.
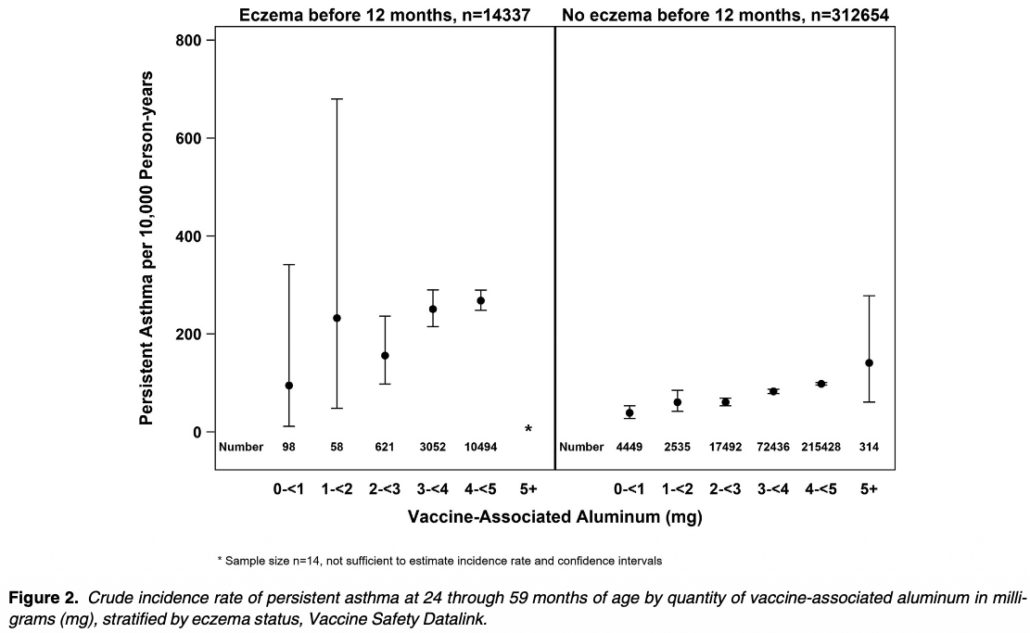
In summary, they found the following:
Each additional 1mg of vaccine-derived aluminum increased the risk of persistent asthma by:
26% in children with eczema (aHR 1.26; 95% CI: 1.07-1.49
19% in children without eczema (aHR 1.19; 95% CI: 1.14-1.25)
Receiving more than 3.0 mg of aluminum increased the risk of persistent asthma by:
61% in children with eczema (aHR 1.61; 95% CI: 1.04-2.48)
36% in children without eczema (aHR 1.21-1.53)
Physicians for Informed Consent does an excellent job summarizing which vaccines contain aluminum and quantifies the amount.
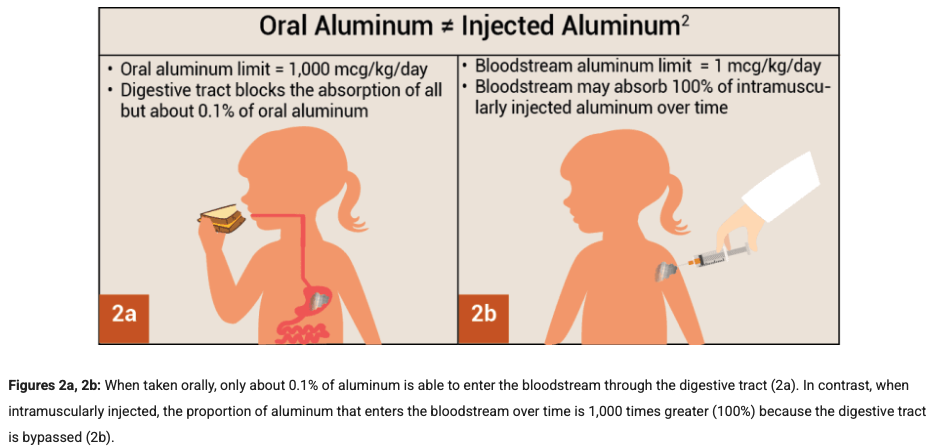
The average weight of a 6 month old infant is 8 kilograms, 12 month old – 10 kilograms, 24 month old 12.5 kilograms.
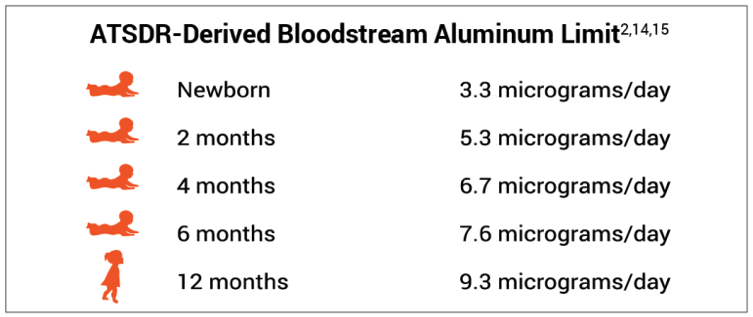
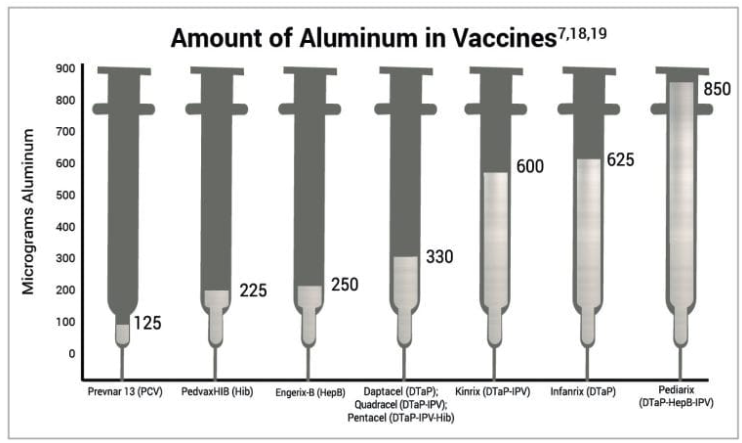
As you can see, each individual vaccine contains far more than the recommended safe amount of aluminum. It is highly likely that the cumulative amount of aluminum in childhood vaccines, especially those delivered during infancy, is a significant contributor to their adverse effects.